![]()
The POS Monitoring Tool monitors and track the POS terminals deployed in the market which allows client to monitor the health and issues of the POS terminals for example connectivity, maintence issues and necessary alerts gives clients an edge to monitor their inventory deployed in the field. This is one of the only solutions of its kind that is available in the Middle East and is an independent system that works with all types of terminals. It has low maintenance for solution and faster response time.
Equipped with an Online Dashboard, this tool provides executive MIS, stocks and inventory on registration and uptime status of terminal by using an online geo map and tracks the performance of terminals based on territory/location where these terminal are deployed. This unique monitoring tool logs and detects maintenance issues with uptime at the minimum due to the possibility of fixing the problem on the initial call. The system detects the type cards being used on the terminals and allowed an easy settlement process for merchants and customers.
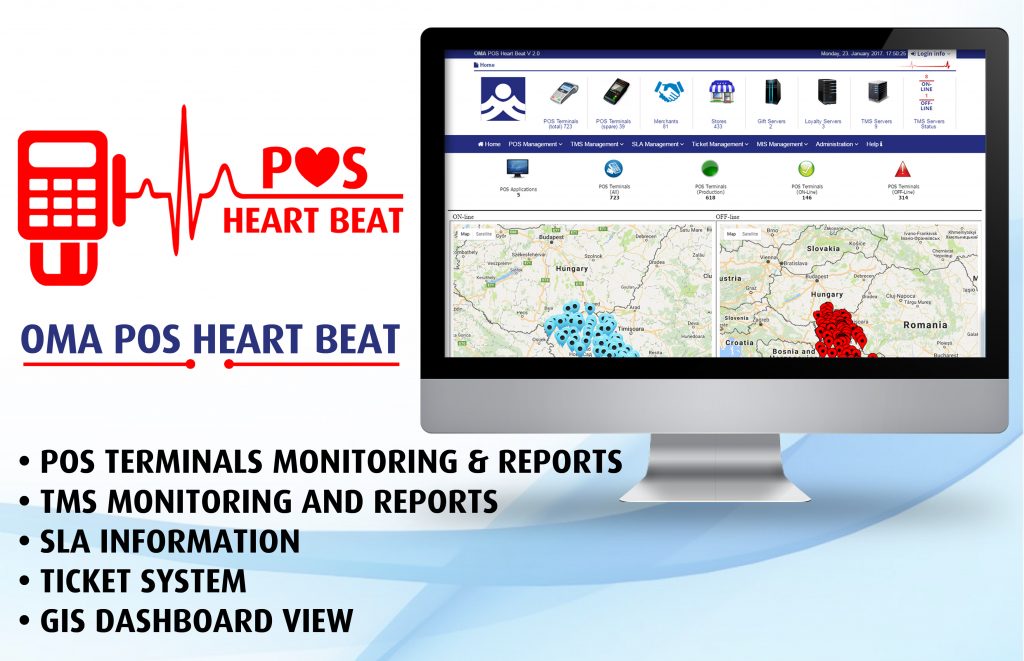
POS Heart Beat is WEB based application, with business functions which enable to control the lifecycle and all aspects of POS Terminals, Terminal Management Servers and related Operations:
POS Management, TMS Management, SLA Management, Ticket Management, MIS Management, Administration, Help
The main business idea of PHB is to provide POS and TMS monitoring functions, asset management, management information, operational reporting, SLA management business functions connected with relate processes of POS deployment and roll-out.
PHB have the following business functions which enable to control the lifecycle all aspects of POS Terminals, Terminal Management Servers and related Operations / GIS / MIS data:
- POS Management
- TMS Management
- SLA Management
- Ticket Management
- MIS Management
- Administration
- Help
PHB Uses the latest Microsoft ASPX .NET (WCF / Entity Framework) technology in combination with advanced Microsoft SQL Server IT and business functions (SSAS, SSIS, SSRS) which enables seamless integration and online data across all communication channels.
At the same time by usage of Microsoft SQL Server Analysis Service technology PHB can conduct the predictive statistical analysis and deployment of sophisticated prediction algorithms on PHB data pool (POS, TMS).

POS Terminals (active) – represent number of POS Terminals in producition
POS Terminals (spare) – represent number or spare POS terminals
Merchants – represent number of Merchants in POS network
Stores – number of retail Stores in POS network
TMS Servers – number of active TMS Servers
Behind every KPI, you can see detail information about every KPI
POS Dashboard
This business functions represents the single view of the complete POS network with all major business and IT KPIs.
PHB uses the latest application components, which allows to users to do Group by and Filter By functions within the grid on the application form. Above presented POS Dashboard contains the set of highly comprehensive POS data assembled in KPI and Details Grid form, which by usage of advance Group by and Filter by functions of PHB enables to the PHB operator easily to track down aggregated status of the complete PHB Network and obtain on one click complete set of details for selected criteria’s:

For example, on the above presented picture PHB operator can see how POS Dashboard can look like if we perform the simple Group by function applied on POS Chains. By using the similar Group by and Filter by filters it is possible to perform much more complex POS data filtering and group by presentation which can focus some important business aspects and performance of the total POS network, Chain, POS Type, Application Type, Stores,…
This kind of representation of data is especially for the business manager who want to see online the group by data of POS network and to put in the correlation with the different business and IT attributes. In the same time this data is also possible to obtain through the different kind of reports within MIS Management tool box.
